January 2024 Arctic Outbreak
The Northern Rockies region of North Idaho and Northwest Montana is largely dominated by more of a maritime polar climate especially during the winter months featuring an abundance of cloud cover and frequent rounds of mainly light amounts of rain and snow. Thus far for the winter of 2023-2024 this has again been the case. While polar outbreaks are common at least a couple of times each winter true arctic airmass outbreaks are rather rare in our part of the country. This is due to the fact that true arctic air is often extremely cold, dense and dry. With our region lying entirely west of the Continental Divide it is extremely difficult for a true arctic airmass to be deep enough to spill over the Continental Divide into Northwest Montana and North Idaho. From January 11 to January 15, 2024 an unusual, record breaking arctic airmass did in fact settle into the region. This was advertised and warned about several days up to a week in advance by computer models which overall did an excellent job of showing this event taking place. There were a lot of wrong depictions of where this airmass originated from as well as how cold temperatures actually got listed by the media and social media. The goal of this article is simply to present the reader with the simple data along with charts to show what really happened although the end result likely does not change. We all know it was brutally cold but for those of you who like to know the “why” behind the “what” keep on reading.
The coldest temperatures recorded during the January 2024 arctic outbreak all occurred on Saturday morning, January 13, 2024 with the exception of the Libby Dam CO-OP site which recorded its coldest temperature on Sunday, January 14, 2024 likely due to some wind the previous day. Here is a list of the official low temperatures along with the historical coldest temperatures on record for the same sites:
Location Temperature/Date All Time Record Low, Date & Year
Bonners Ferry, ID - 20 F, 01/13/2024 - 33 F 12/30/1968
Sandpoint, ID - 19 F, 01/13/2024 - 37 F 12/30/1968
Dover, ID* - 26 F, 01/13/2024 N/A
Eureka, MT - 33 F, 01/13/2024 - 50 F 12/30/1968
Libby(Airport), MT** - 39 F, 01/13/2024 - 46 F 01/02/1924, - 39 F 12/30/1968
Thompson Falls, MT - 22 F, 01/13/2024 - 25 F 12/30/1968
Libby Dam, MT*** - 27 F, 01/14/2024 - 27 F 01/14/2024
* Dover, ID is where the author has resided since 2020 with no official records listed for this location.
** Libby Airport has not kept official records prior to 2016. Records listed for this location were all taken at the Libby Ranger Station at the West end of town and tend to run around 4 to 6 degrees warmer than observations taken at the airport. This site no longer keeps records for Libby.
***Libby Dam records only go back to September 1986.
As you can see it was definitely cold and I’m sure most of us remember this cold snap. Keep in mind that the National Weather Service official observation sites have to meet certain criteria including temperature observations. Temperature sensors need to be located 6 feet off the ground and at least 1,000 feet from any structure or object so as to allow free air movement around the sensor. Sandpoint, ID numbers are relatively warm comparatively speaking as this location had northeast winds blowing throughout the event which prevented temperatures from dropping to their full potential. The Dover, ID site had no wind on the night and morning of January 13, 2024 which is why the large temperature difference in just a few miles. Wind chill values were exceptionally cold with the top of Schweitzer Mountain recording a wind chill of - 55 below zero on the morning of January 13, 2024. The “winner” however was Big Mountain summit at the top of Whitefish Mountain resort which recorded an astounding -64 below zero on the morning of January 13, 2024! That is incredibly cold. Also of note was the balloon launch sounding taken near the Spokane airport the morning of January 13, 2024. Here is the data from that launch:
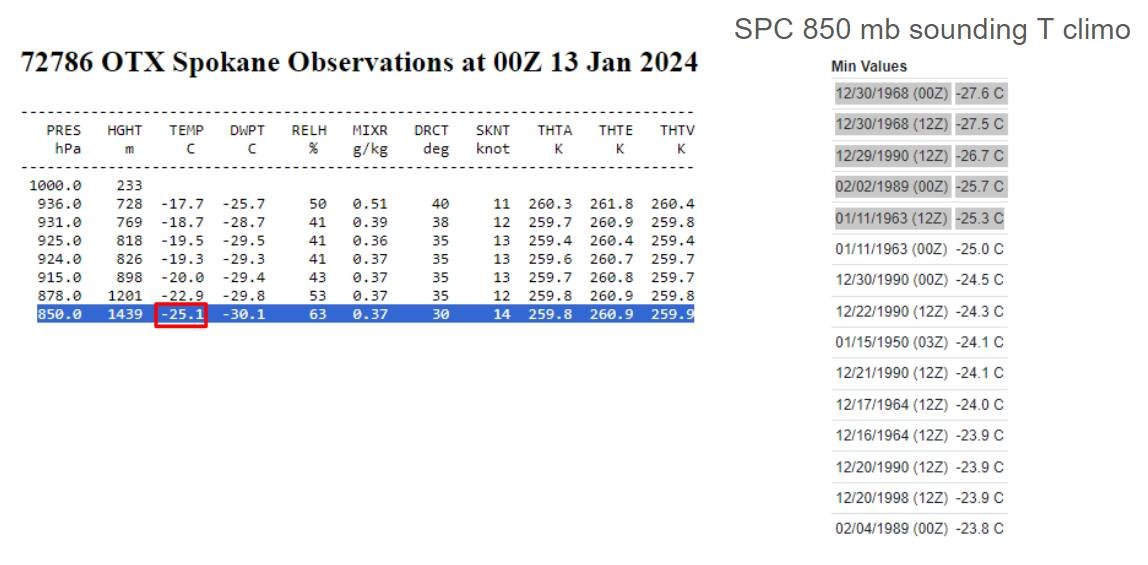
Spokane sounding temperature taken on Thursday, January 12, 2024 at 00Z which is 4:00 p.m. PST January 12, 2024. The temperature highlighted in blue outlined with a red box shows the temperature at 850 mb or roughly 5,000 feet above sea level. -25.1 degrees celsius is - 13.2 fahrenheit! This ranks as the 6th coldest temperature on record for Spokane since weather balloon launches began and is only 2.5 degrees celsius (4 degrees fahrenheit) colder than the December 30, 1968 recorded temperature! Image courtesy of the National Weather Service, Spokane, WA.
If you read the caption underneath the chart you can see that it was definitely cold, VERY COLD! So where did this cold come from? Most TV meteorologists were shown stating that this cold air came from Alaska and dropped down following the jet stream into our region. This however, is actually factually not true. The origin of the cold air was in fact arctic in nature but it originated in an area that most people would not expect in our region, near Greenland. Take a look at this series of charts below and follow the large, purple blob in the first picture just to the west of Greenland and follow its progression.
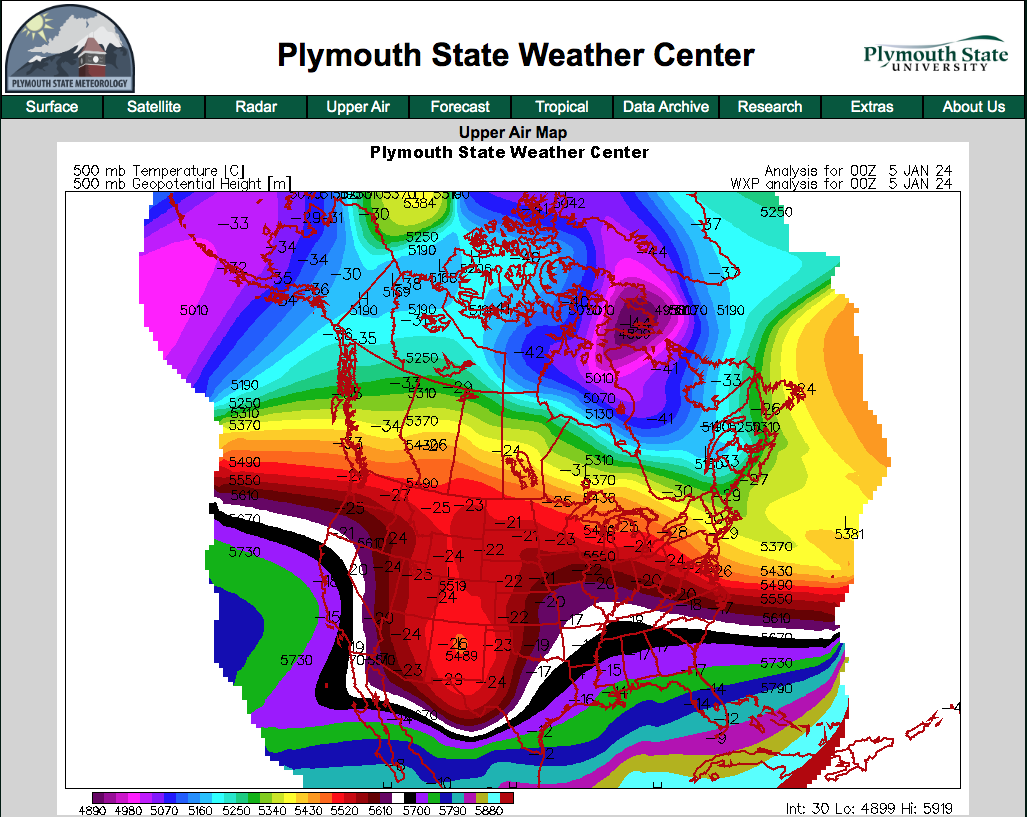
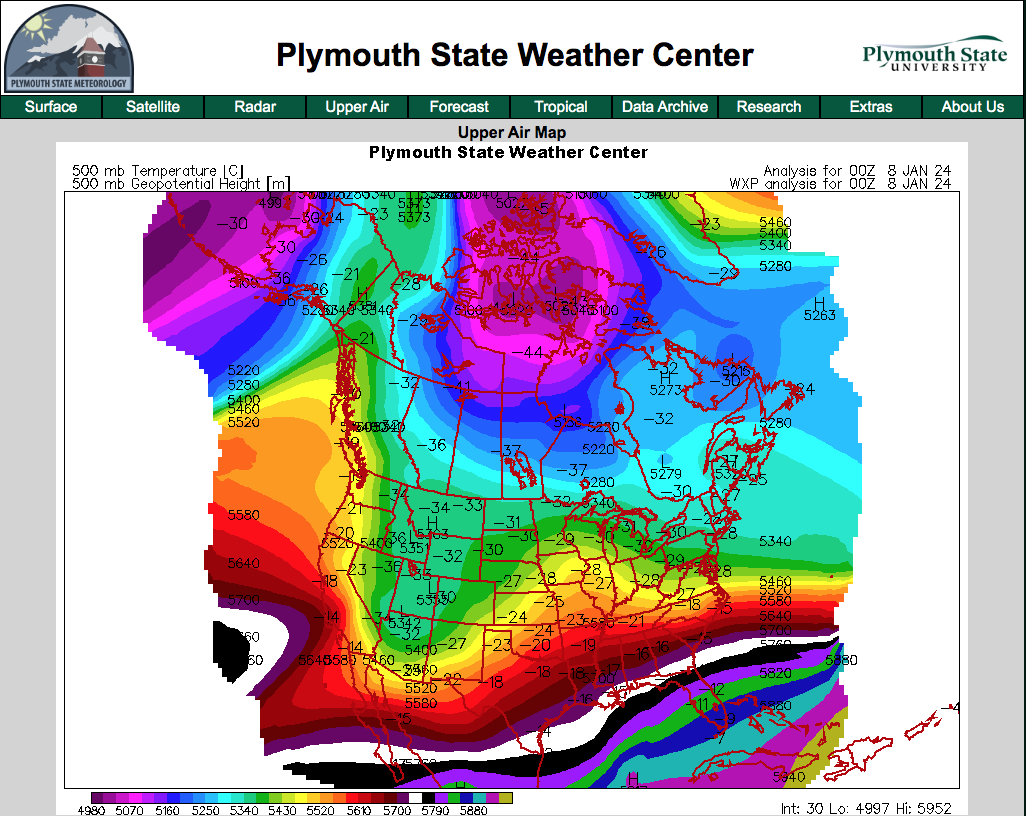
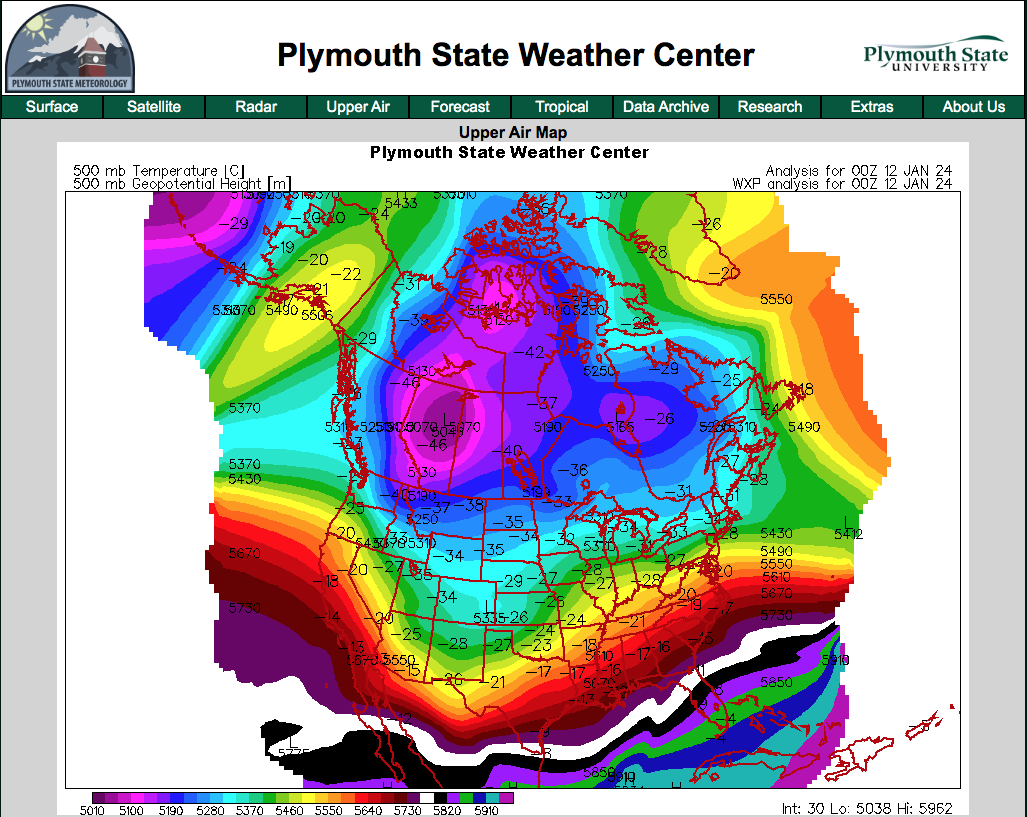
These 8 charts are color coded from Plymouth State Weather Center and show 500 mb (approximately 18,000 feet above sea level) atmospheric heights and corresponding temperatures given in degrees celsius noted by the black numbers. They are listed in order starting with 00Z on January 5, 2024. 00Z corresponds to the around 4:00 p.m. PST the previous day so 00Z on January 5, 2024 is 4:00 p.m. PST/5:00 p.m. MST on January 4, 2024. There are two darker purple areas on this first chart, one over the Gulf of Alaska and the other one developing over northeastern Hudson Bay and Greenland. It’s this one that we follow. By 00Z on January 6, 2024 the Gulf of Alaska low has begun to modify and retrograde back towards Kamchatka but our arctic low off of Greenland has enlarged and gotten colder as evidenced by the greater spread of purple coloring. It is important to note that across the polar regions weather patterns move in the opposite direction than in the mid latitudes where we reside often moving from east to west similar to in the tropical regions rather than from west to east. The arctic low is retrograding or moving from Greenland into Canada. We skip ahead to 00Z on January 8, 2024 and now see the arctic low squarely over Nunavut, Canada. In the last frame on the top which is 00Z on January 9, 2024 we see the arctic low starting to show some signs of dropping further south as well as backing up further west into the eastern part of the Northwest Territories in Canada.
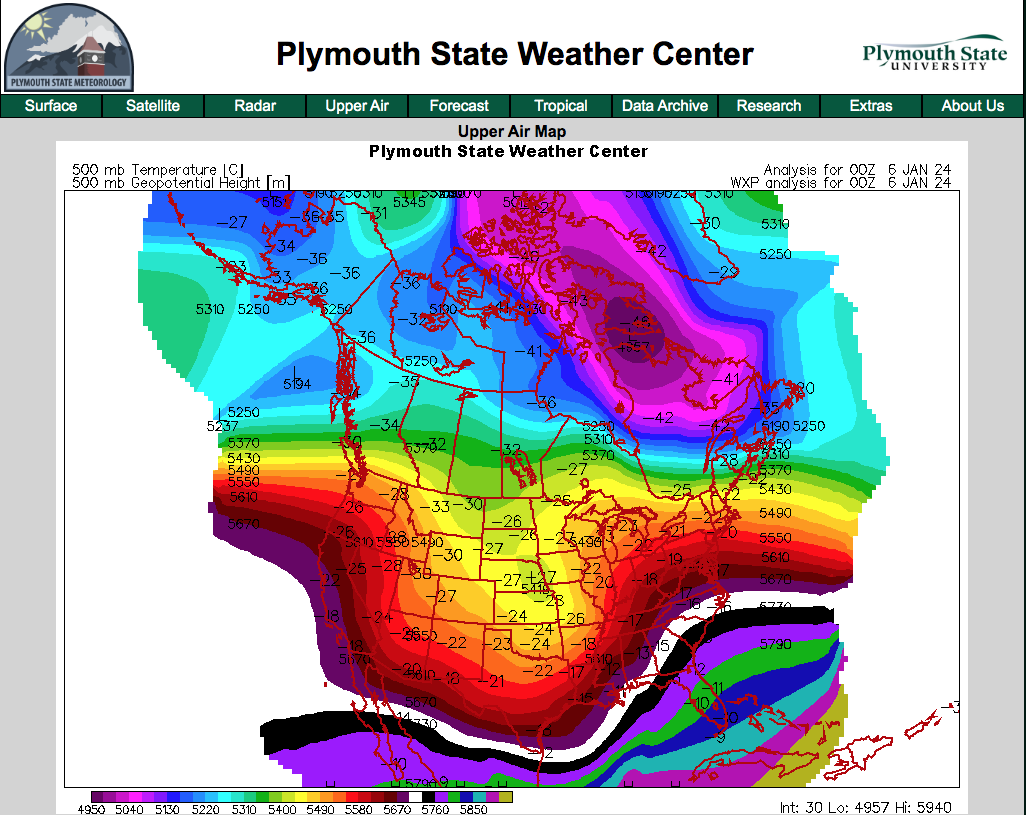
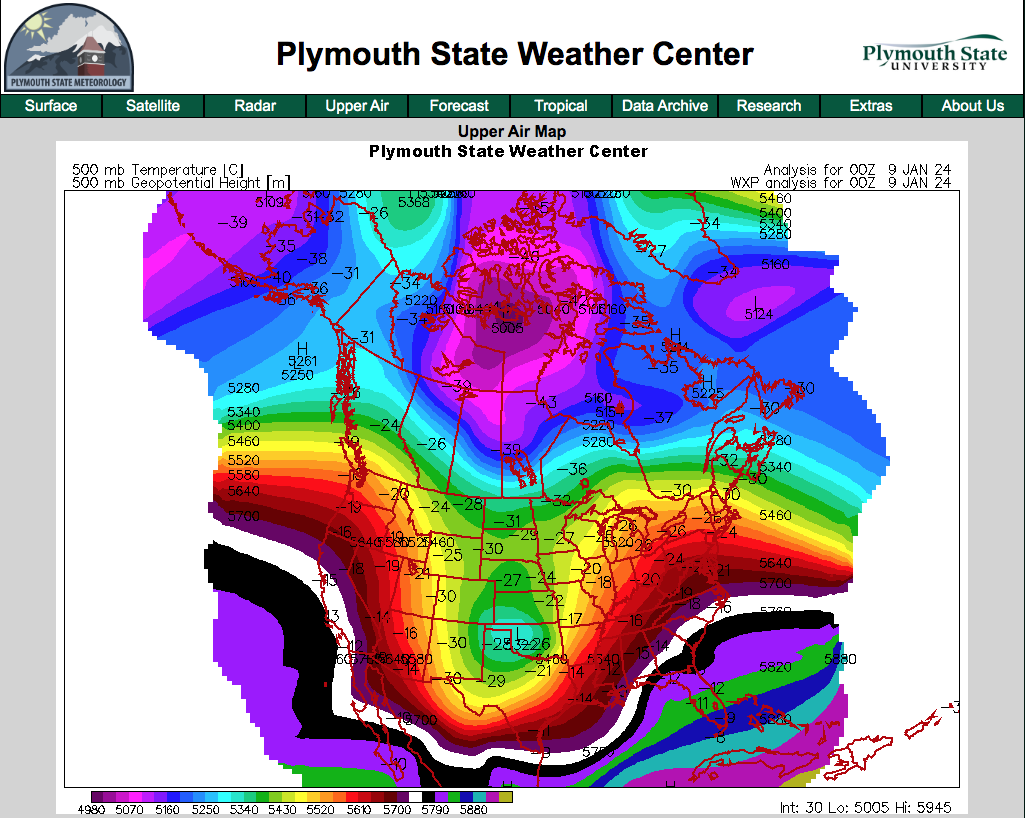
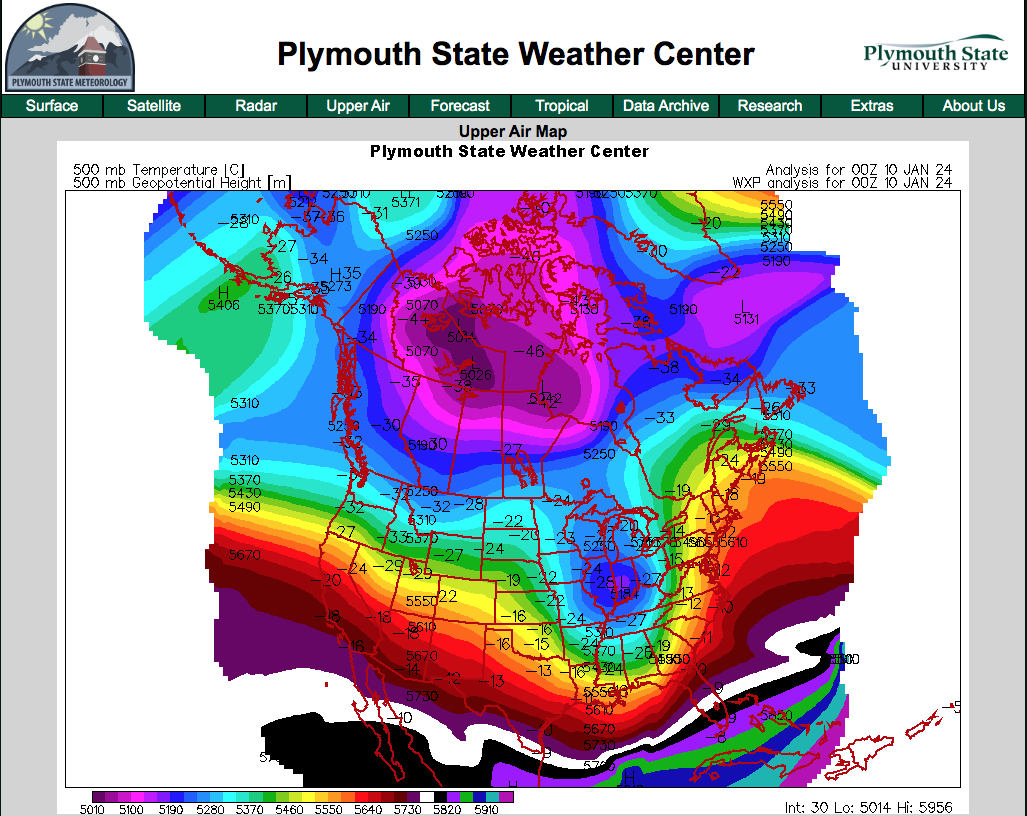
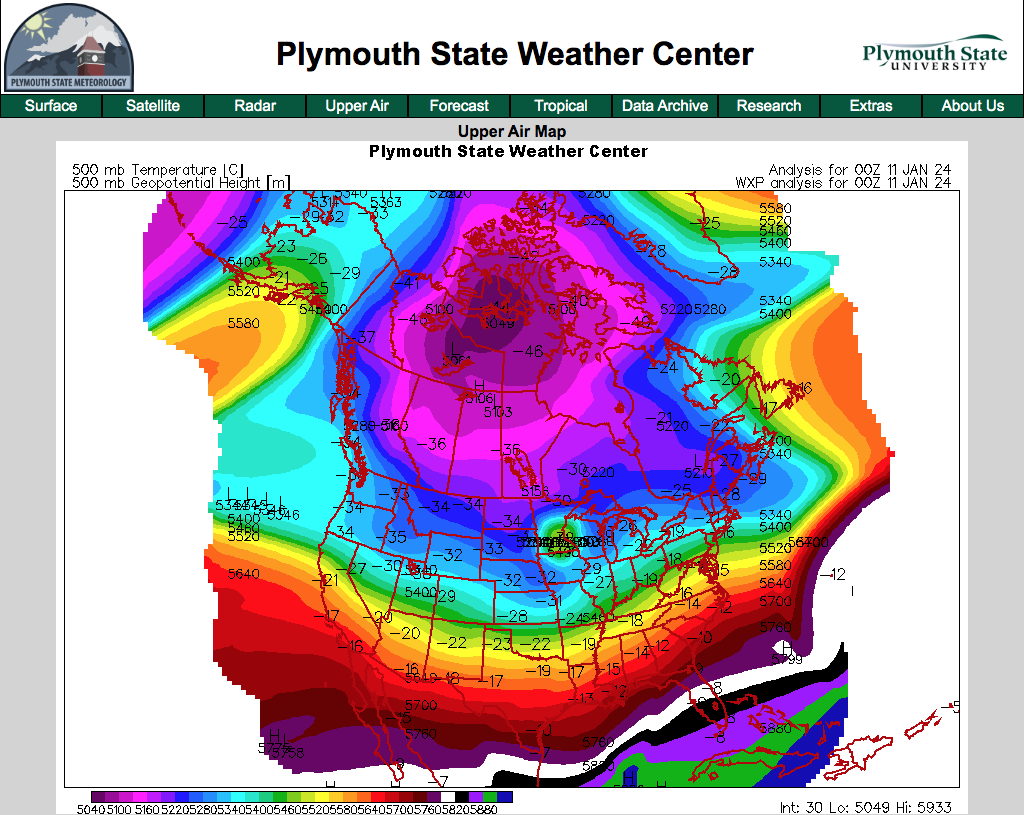
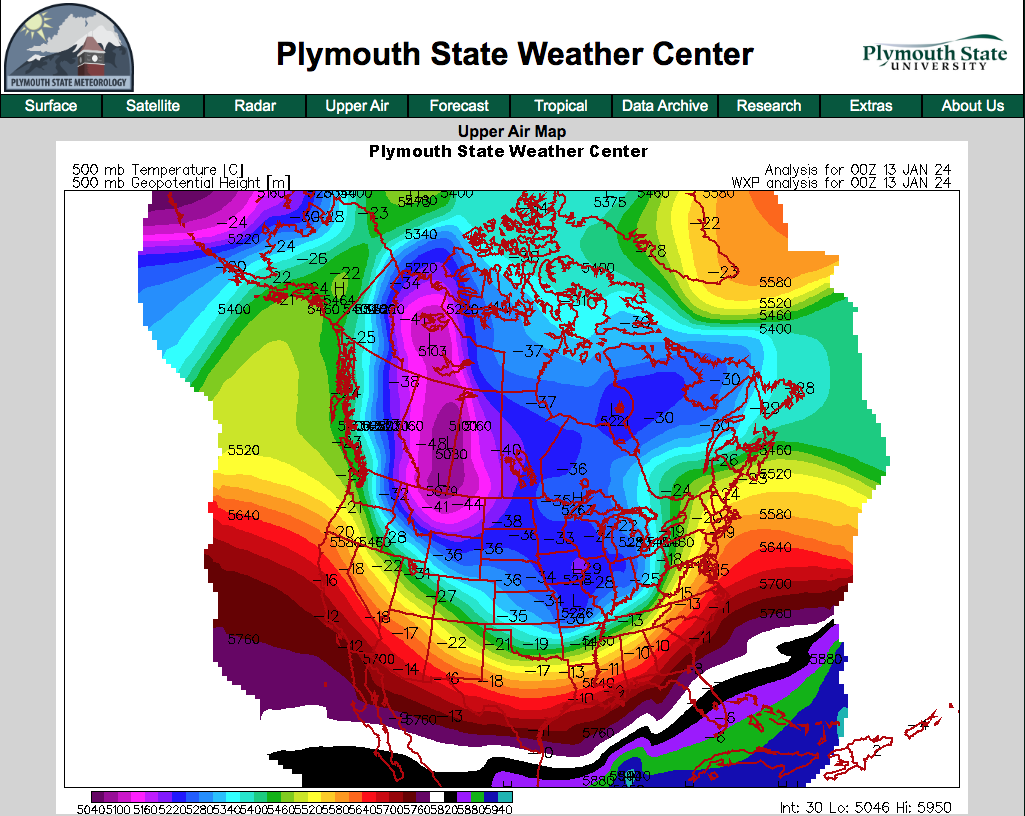
The next frame, which is 00Z on January 10, 2024 on the bottom left shows the arctic low now over the Northwest Territories and beginning to drop further south into northern British Columbia and Alberta. There is also another subtle yet very important feature in this frame. If you look to the south and west of the arctic low you will see an extension of blues out into the Northeast Pacific and eastern Gulf of Alaska. This is the Pacific shortwave that brought the heavy snowfall we saw at the beginning of the cold snap. It is important as this weakness in the atmosphere and its associated lower atmospheric heights provided the arctic low a weakness in the atmospheric height field denoted by the “colder” colors and enabled the deep cold air to push further south and west rather than the typical south and east path arctic lows typically take. By 00Z on January 11, 2024 you can see our region beginning to come under the southern fringes of the influence of the arctic low with blue shadings at 500 mb beginning to spread across our area from the north. By 00Z on January 12, 2024 the arctic air is now beginning to pour into the region and surface observations from that day showed strong and gusty east to northeast winds developing and spreading across Northern Washington and Northwest Montana with North Idaho under a surface trough at that time which delayed the winds for a while but kept moderate to heavy snowfall going. By 00Z on January 13, 2024 our region has plunged into the grips of the arctic low as evidenced by the purple colors across our region. You might be able to make out some of the 500 mb temperatures on this map showing temperatures of - 41 to - 44 degrees celsius (- 42 to -47 degrees fahrenheit) over Central Montana. If you thought it was cold here, (and it was) most areas across Central Montana saw temperatures between -45 and -50 and with wind speeds in that region only around 5 mph or so, wind chills were an incredibly and dangerously cold -65 to -70 below zero!
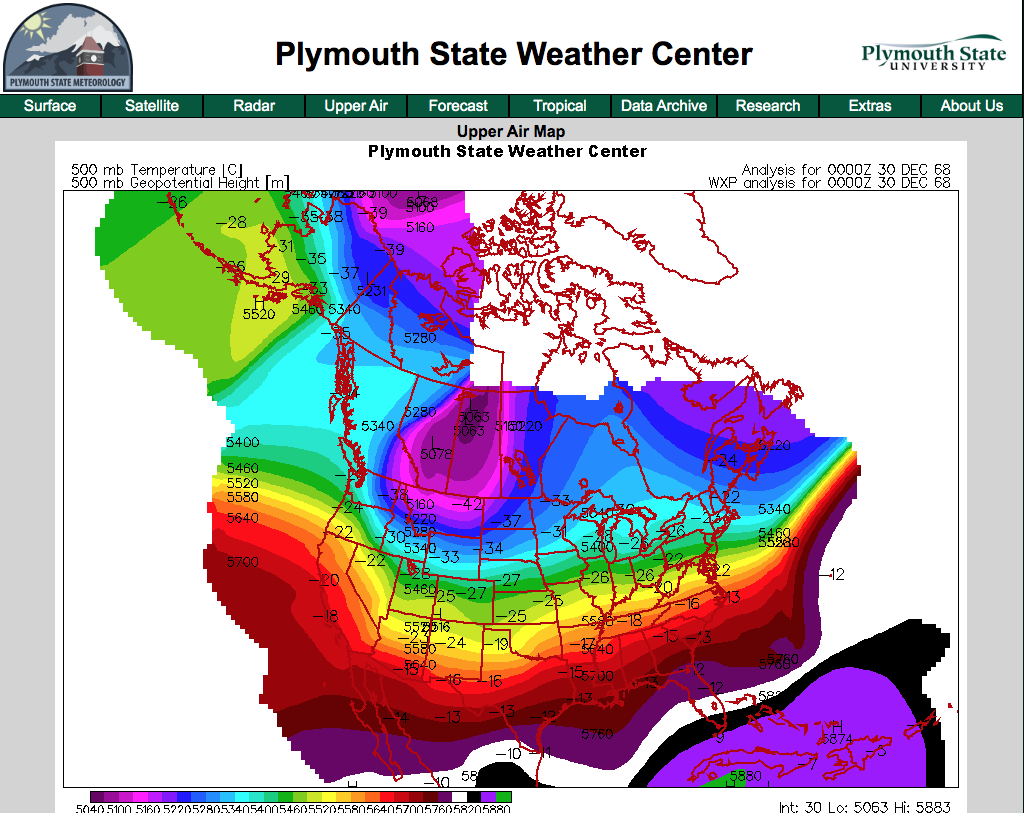
Hope this article was interesting and helpful and helps you know that many times what the TV meteorolgists tell or show you on TV is sometimes factually incorrect. So when someone mentions to you about the cold snap in January 2024 coming from Alaska you can now correct them and say well it actually came from Greenland and Nunavut, Canada and while still brutally cold, it wasn’t the fault of the great state of Alaska! For those of you who are curious about the same charts and data for December 30, 1968 here is a reanalysis of that day as well. Looks surprisingly similar doesn’t it?